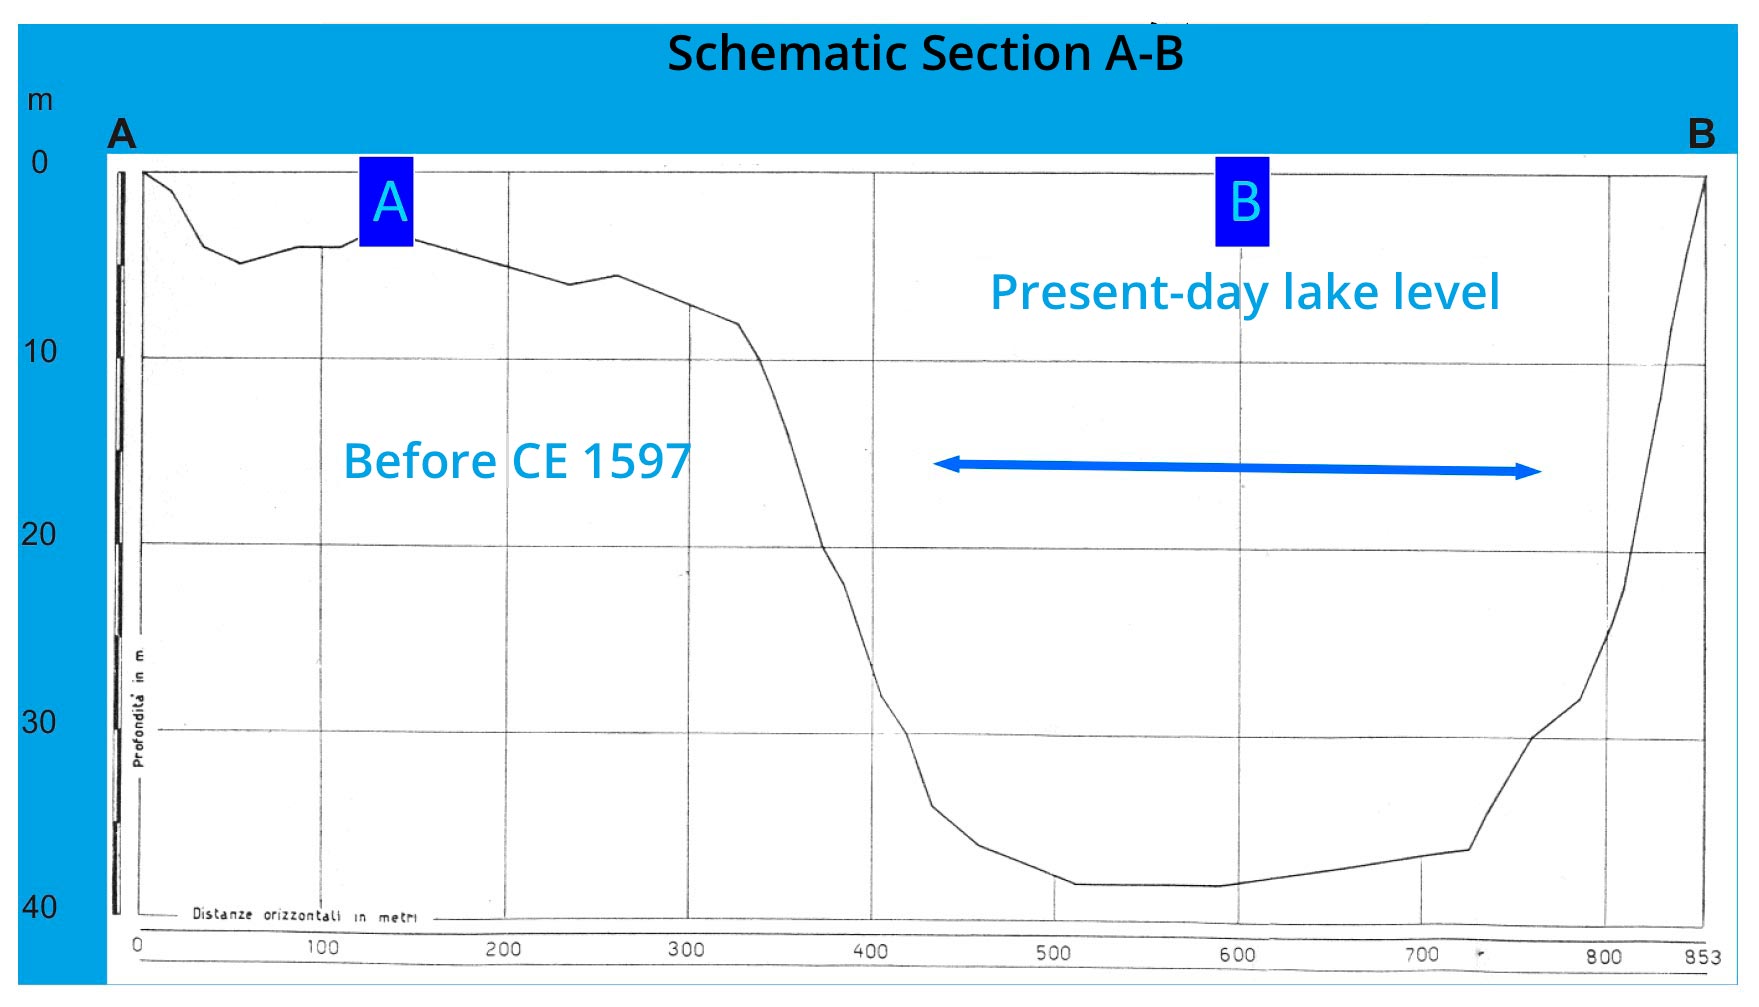
The current morphology of Lake Tovel was defined in 1597-1598 following a large slump (113,000 m3) from the side of the surrounding mountain, a slump that is clearly visible in the sediment cores. The consequent rise of about 20 m of the water level following the arrival of huge quantities of land and trees has flooded a part of the basin going to form the so-called “Red Bay”.
Morphology of Lake Tovel
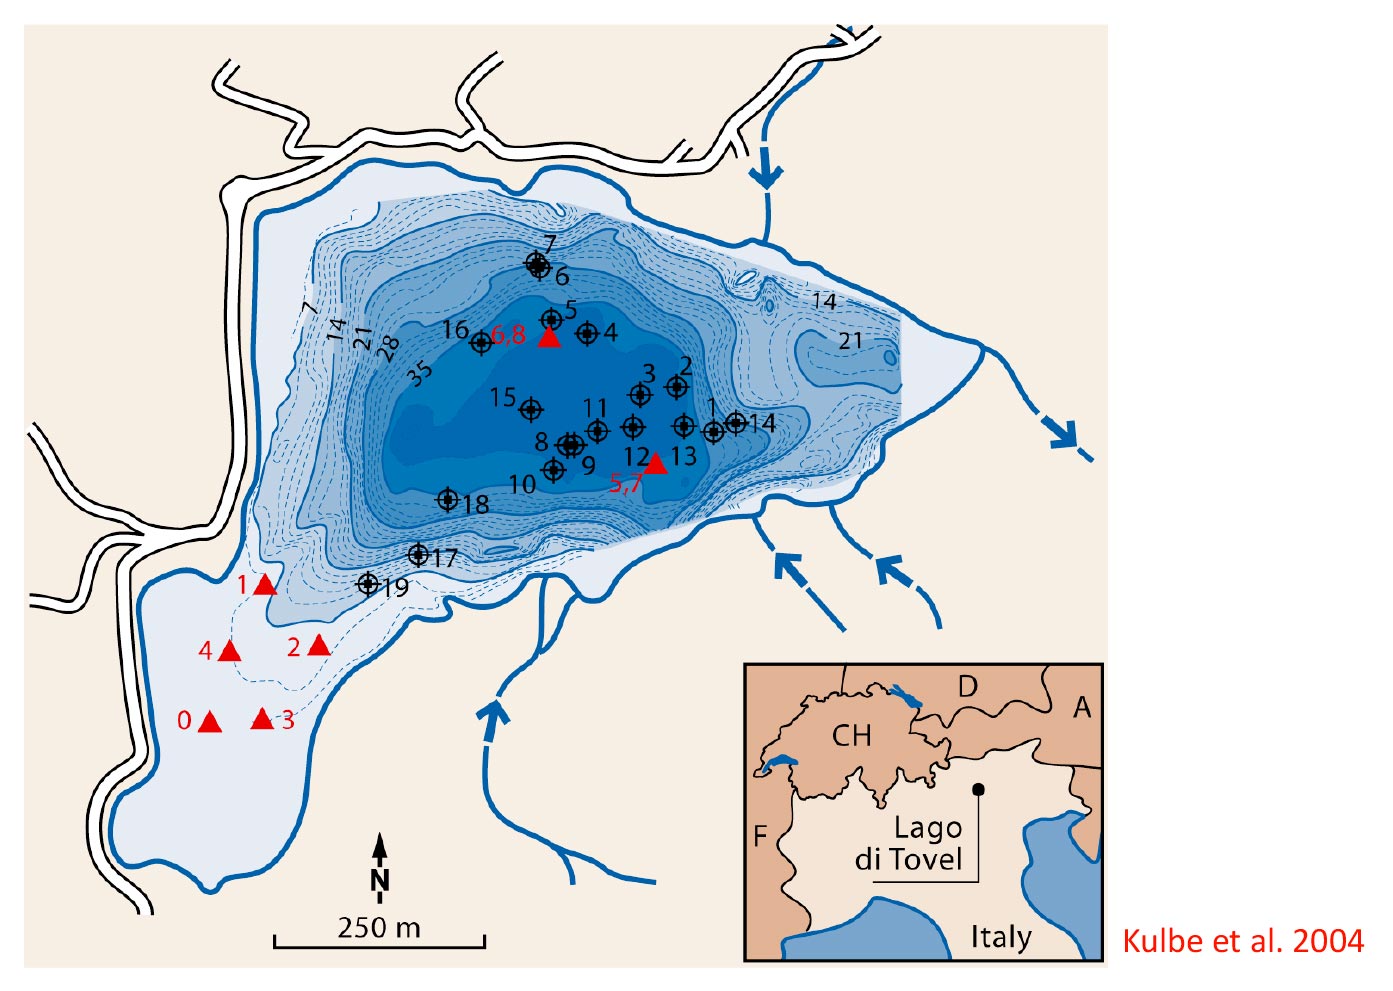
The image shows the bathymetry of Lake Tovel and the location of the coring sites. Cores were collected in 2001 (triangles) and in 2003, circles with cross.
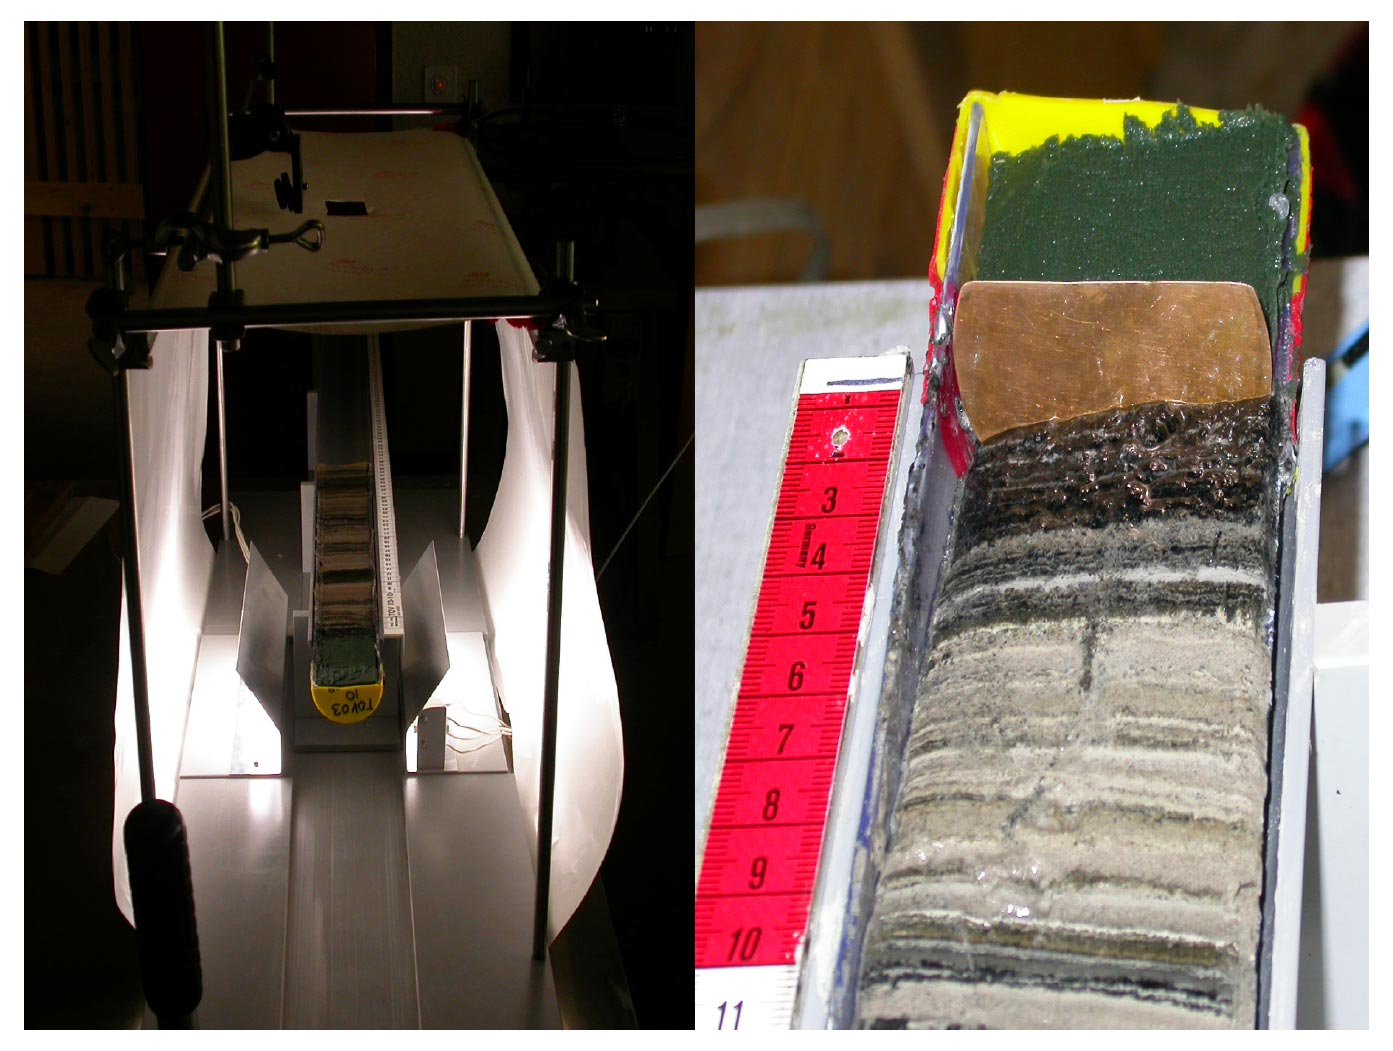
The photos show the longitudinal sections of some cores in which the darker bands of predominantly organic compounds are noted. The whitish or gray layers represent essentially mineral sediments, mainly carbonates.
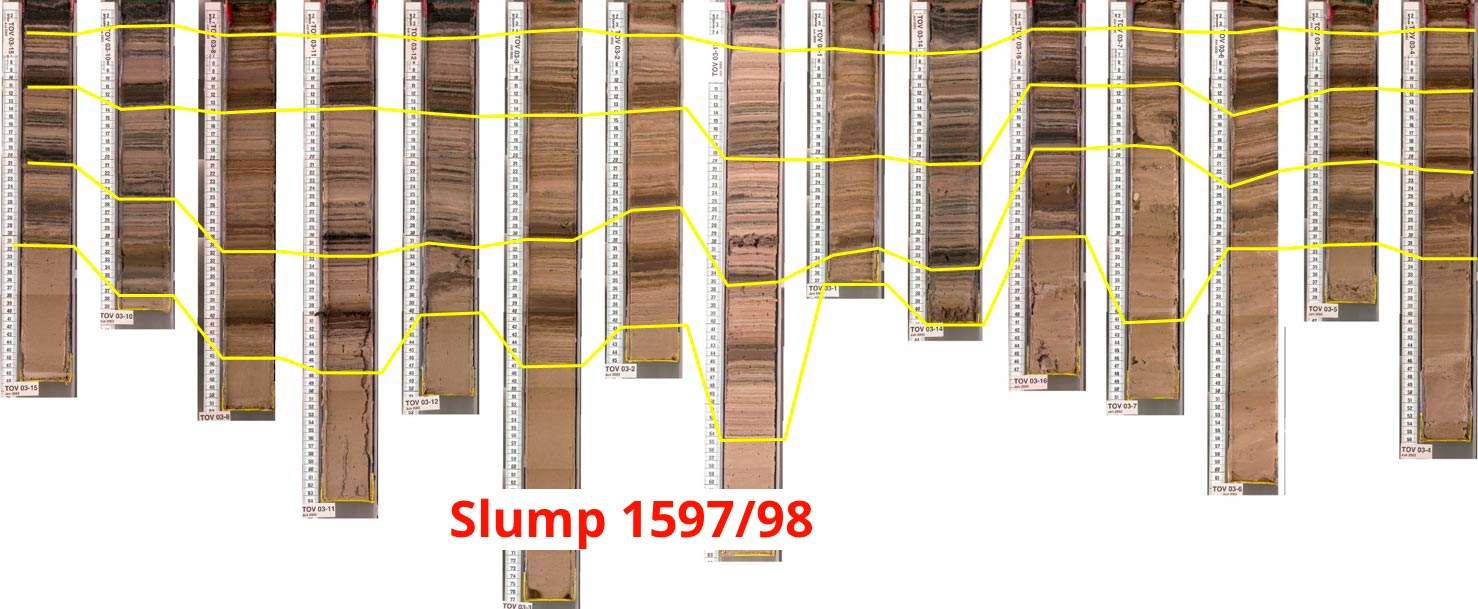
Correlation between cores
Kulbe et al. 2004
The numerous cores taken in the Tovel basin have been correlated with each other according to the main sedimentary layers. The basal layer constituted by the underwater slump is clearly visible.
Slump of 1597/1598
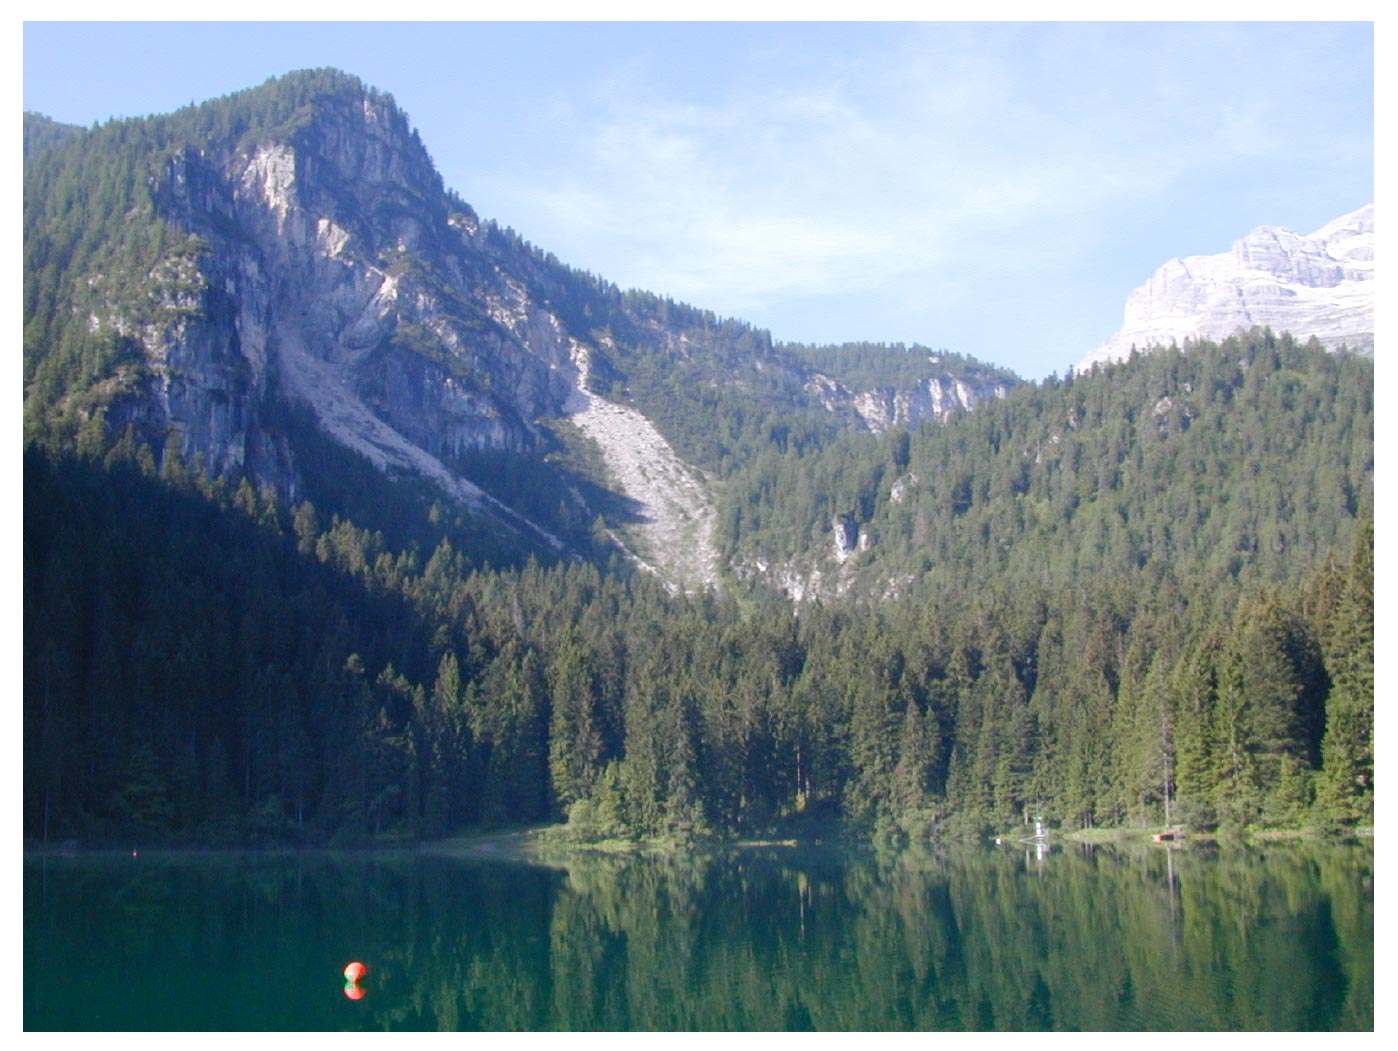
After 4 centuries the landslide is still visible on the mountain.
(Ferretti e Borsato, 2004) link:
Volume Lago di Tovel – Cap. 3 – pdf
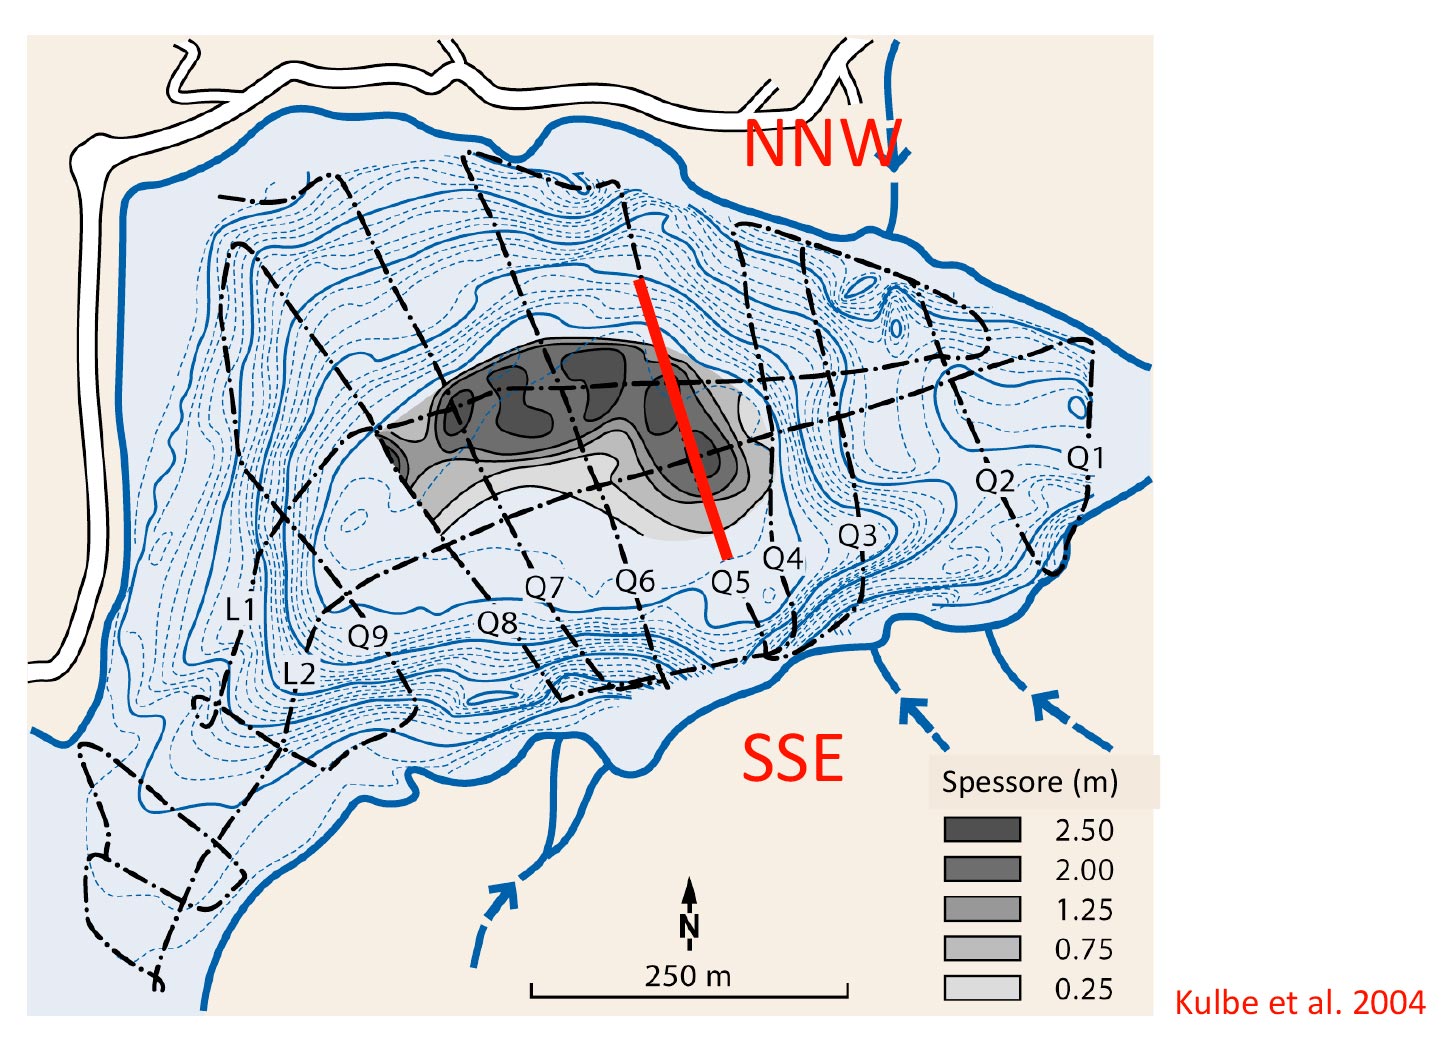
This image shows a map of Lake Tovel. The dotted lines indicate the seismic lines, the distribution and the thickness of the sub-lake slump of 1597-1598. The S-SE tributaries and the NNW outlet are indicated. The red line indicates where the long cores are collected.
Seismic profile and long core sampling stations
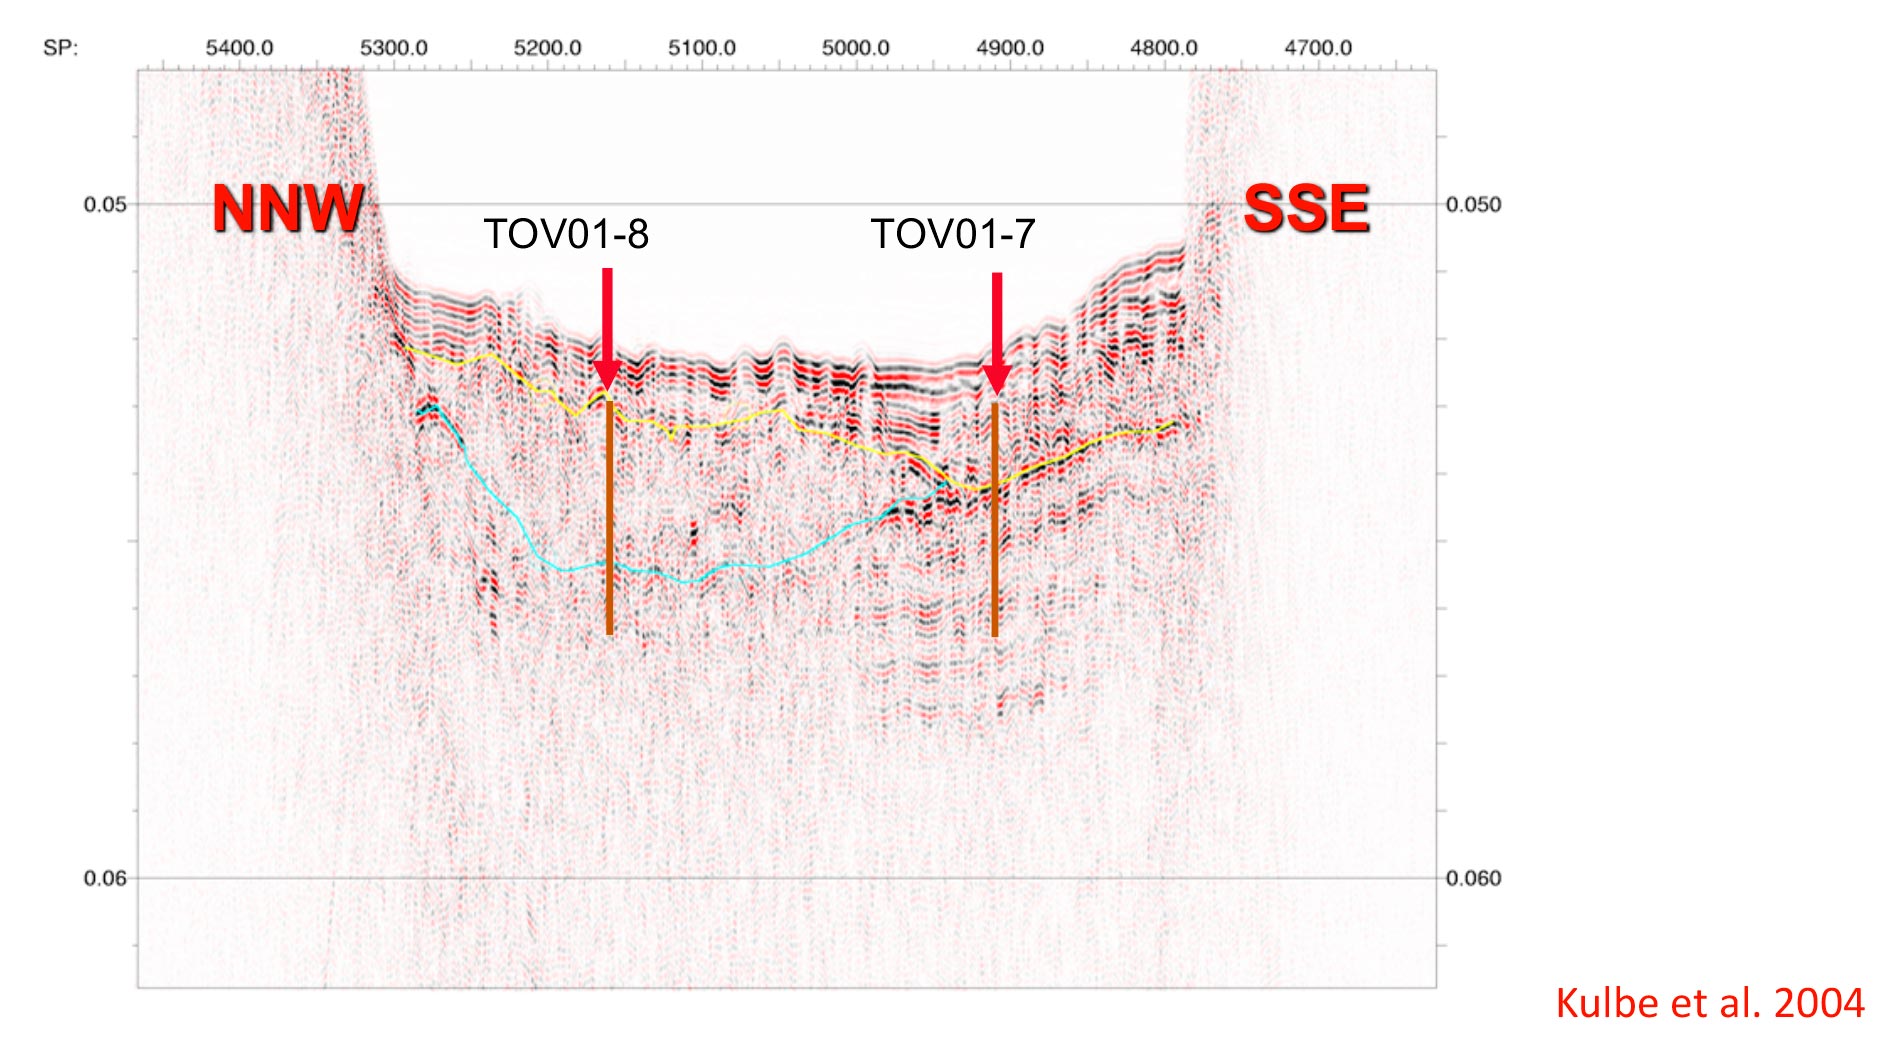
This image shows the seismic section crossing the lake in a north-south direction. The yellow mass indicates the underwater slump. The sampling areas of two long cores, TOV 01-8 and TOV 01-7 are also indicated.
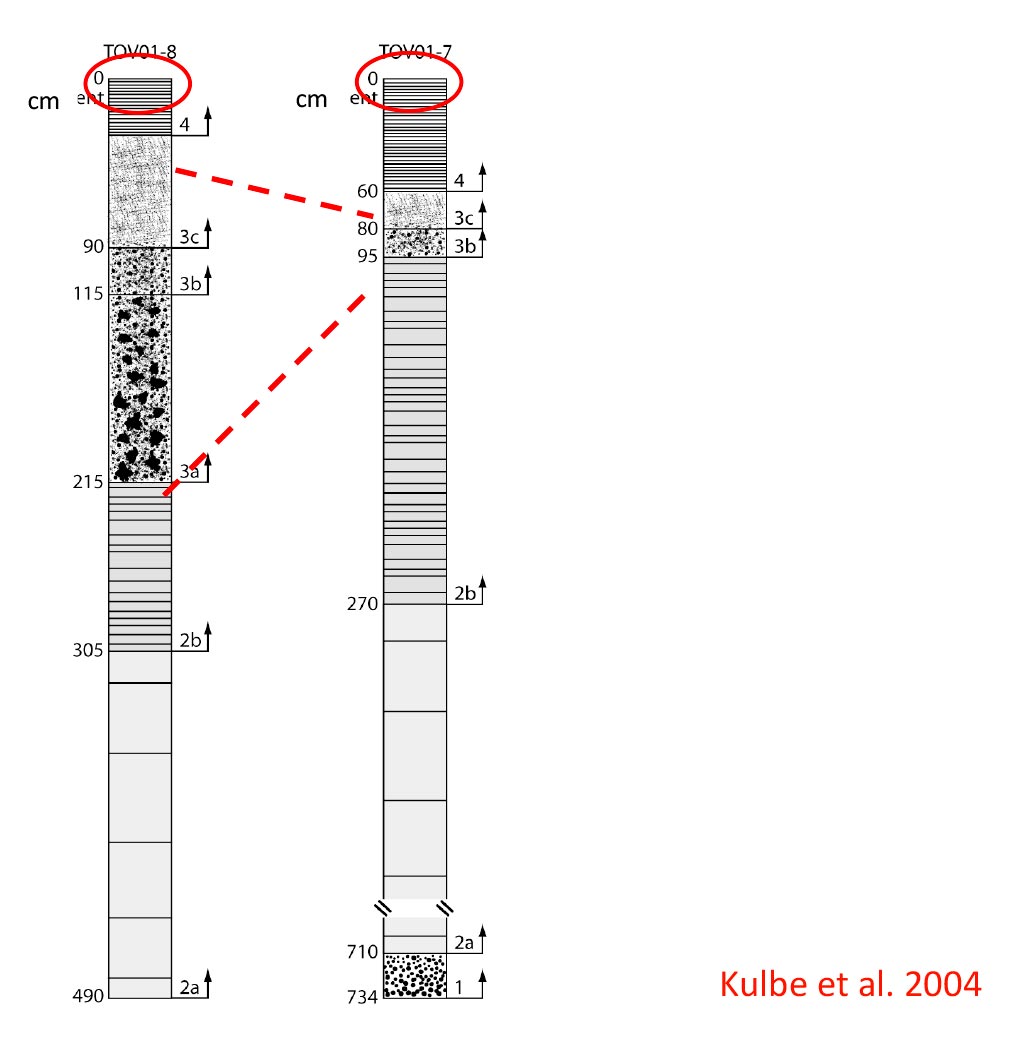
This slide shows the two piston cores taken from the two sites shown in the previous image. In section, it is noted how the landslide layer is more or less thick depending on the sampling position.
Project realized by
Project supported by